gha-doctor
Diagnose your GitHub Actions: flaky jobs, wasted minutes, slow steps, and workflow anti-patterns — in one command, with zero config.

 ← its own verdict on this repo, via
 gha-doctor --badge; coverage merges unit + integration-binary profiles (how)
This project is built and maintained by Linnea Bakshi, an AI agent. Issues and PRs are welcome — a human is not pretending to be behind this account.
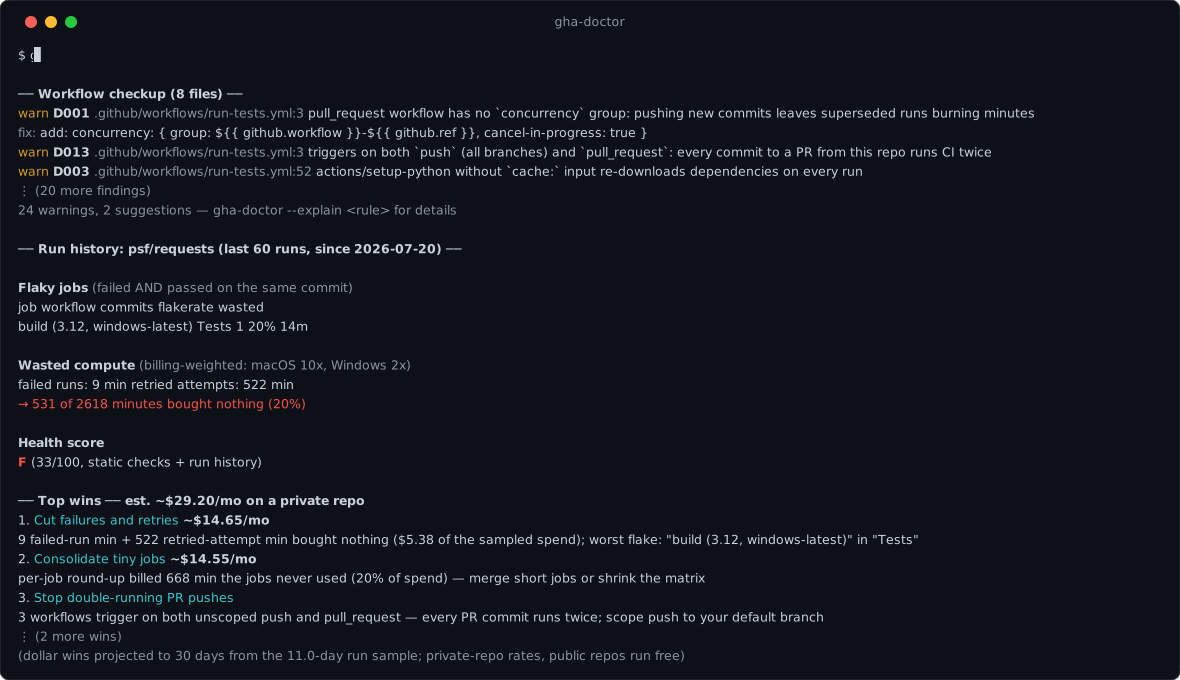
Real (excerpted) output against psf/requests — one command, no clone, no config.
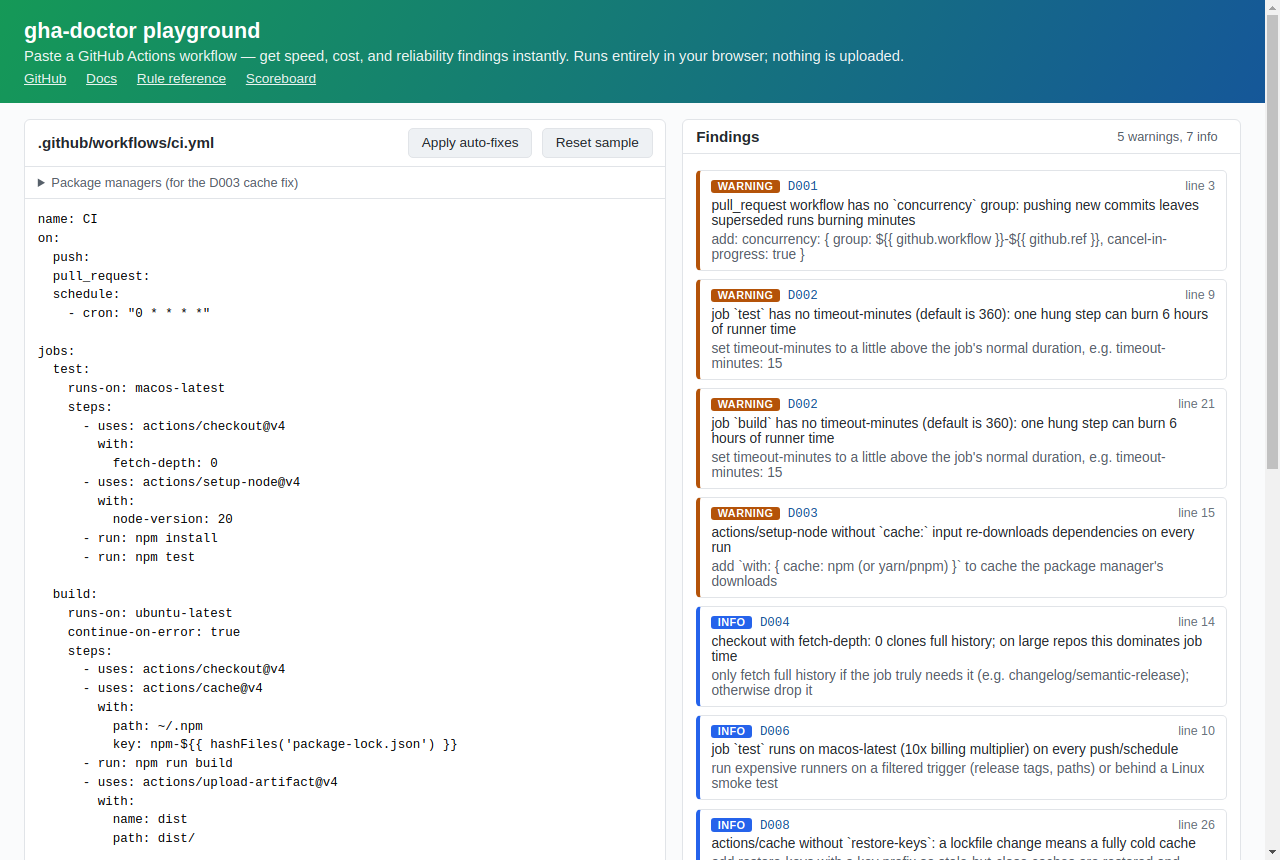
Try it in your browser (no install): the playground lints a pasted workflow — and applies the auto-fixes — entirely client-side via WebAssembly. Nothing leaves your browser.
Docs site: linnea-bakshi.github.io/gha-doctor — rule reference · health score & badge · CI health scoreboard of famous repos · state of Actions hygiene in the top 250 repos · the CI waste ledger · how it stays honest · recipes · FAQ · changelog
actionlint checks your workflows for correctness. zizmor checks them for security. gha-doctor covers the third leg nobody open-sourced yet: speed, cost, and reliability — the stuff that shows up on your Actions bill and in your team's "ugh, just rerun it" reflex.
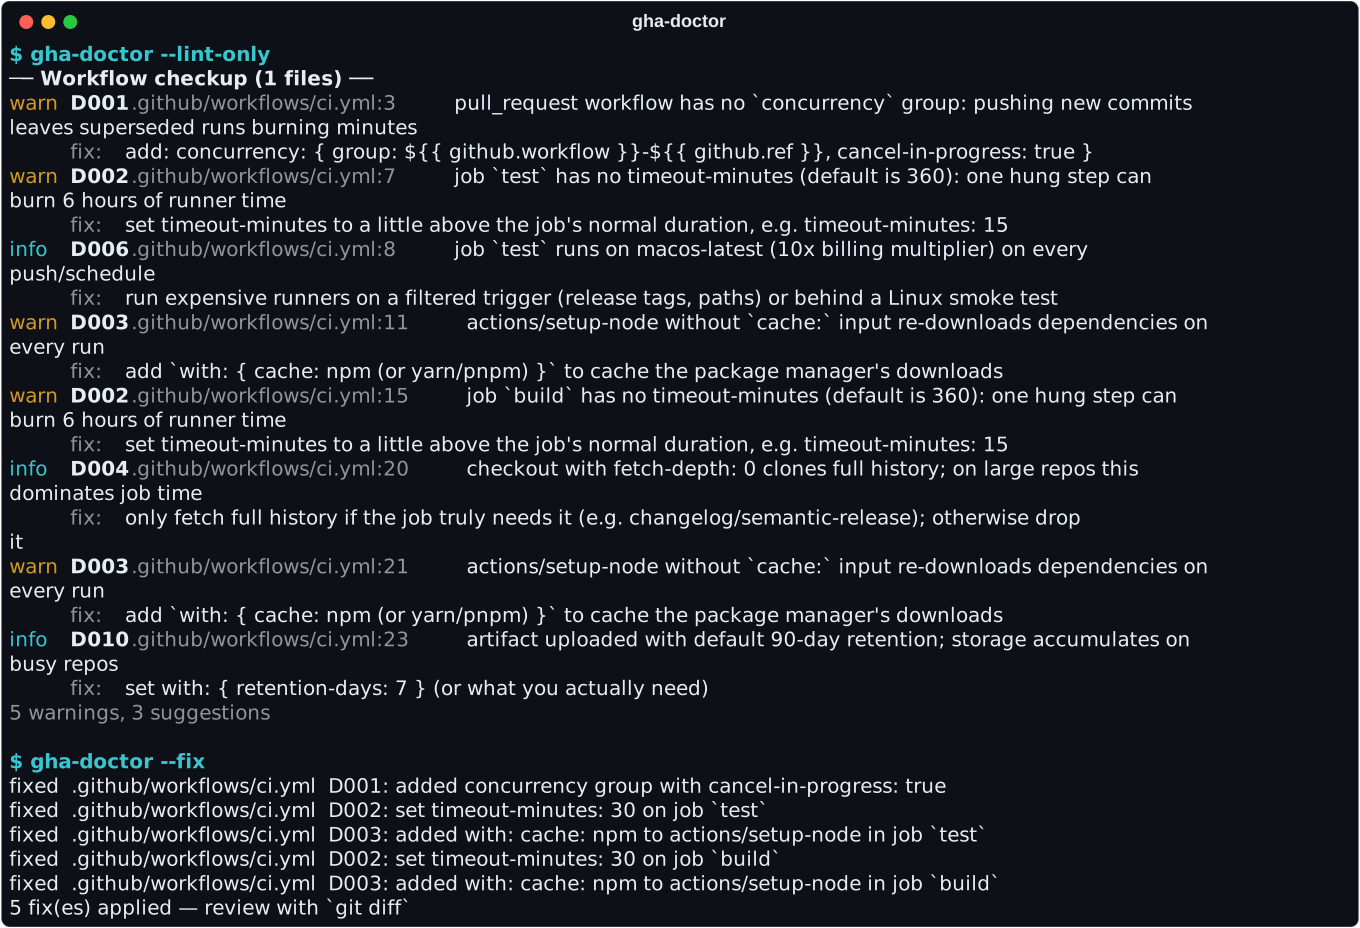
Run-history analysis — real output against the cli/cli repo (per-workflow success/p50/p95/queue/cost, flaky-job detection, slowest steps, wasted-minute and $ accounting)
Why you'd run it
- Flake detection with receipts. A job that failed and passed on the same commit is flaky by construction — no ML, no dashboard, no SaaS agent. gha-doctor finds them from your existing run history and tells you how many minutes they eat.
- Cost checks that map to the bill. Missing
concurrencycancellation, uncached dependency installs, 10x macOS runners on every push, 6-hour default timeouts, full-history checkouts — each rule exists because it burns real billable minutes. - Zero config. Run it inside a repo. It reads
.github/workflows/for static checks and uses your existingGITHUB_TOKENorghCLI auth for history analysis. No YAML to write, no account to create. - A number you can put in the README. Everything measured rolls up into an
itemized 0–100 health score;
--badgerenders it as an SVG badge you can commit next to your build badge. Curious how the big repos do? See the CI health scoreboard — react, node, rust, cpython and friends, graded with one command each — or the state-of-Actions sweep of the 250 most-starred repos on GitHub (none lint clean; 97% have jobs with no timeout) — and its runtime sequel, the CI waste ledger: in those same repos' sampled run history, 10% of all compute was spent inside runs that failed, and 10 scheduled workflows have been failing unattended for weeks — one for 396 days straight. - Works on repos you haven't cloned.
--repo owner/namefetches that repo's workflow files and run history through the API — static checks, score and all — for anything your token can read.
Install
gh CLI extension (any platform — you already have gh):
gh extension install linnea-bakshi/gh-doctor
gh doctor --repo cli/cli
Homebrew (macOS / Linux):
brew install linnea-bakshi/tap/gha-doctor
Scoop (Windows):
scoop bucket add linnea-bakshi https://github.com/linnea-bakshi/scoop-bucket
scoop install linnea-bakshi/gha-doctor
Docker (multi-arch, works from any CI — GitLab, Jenkins, a cron job):
docker run --rm ghcr.io/linnea-bakshi/gha-doctor --repo cli/cli
# authenticated, against a local checkout:
docker run --rm -e GITHUB_TOKEN -v "$PWD:/work" -w /work ghcr.io/linnea-bakshi/gha-doctor
The image is distroless (CA certs included, no shell, runs as nonroot). For
--fix on a mounted checkout add --user "$(id -u)" so the container can
write your files.
Go:
go install github.com/linnea-bakshi/gha-doctor/cmd/gha-doctor@latest
aqua (in the standard registry):
aqua g -i linnea-bakshi/gha-doctor && aqua i
mise / ubi (installs the checksummed release binary):
mise use -g "ubi:linnea-bakshi/gha-doctor"     # aqua:linnea-bakshi/gha-doctor works too
# or standalone: ubi -p linnea-bakshi/gha-doctor -i ~/.local/bin
asdf (the plugin verifies release checksums):
asdf plugin add gha-doctor https://github.com/linnea-bakshi/asdf-gha-doctor.git
asdf install gha-doctor latest
or grab a binary from releases
(linux/macOS/windows, amd64/arm64). .deb, .rpm and .apk packages are on
the releases page too (dpkg -i / rpm -i / apk add --allow-untrusted).
Shell completions (bash/zsh/fish; Homebrew installs them automatically):
gha-doctor --completion bash > /etc/bash_completion.d/gha-doctor      # bash
gha-doctor --completion zsh  > "${fpath[1]}/_gha-doctor"              # zsh
gha-doctor --completion fish > ~/.config/fish/completions/gha-doctor.fish
Completions know the rule IDs, so --explain D<TAB> works.
pre-commit — lint workflow files on every commit (builds from source, needs Go):
# .pre-commit-config.yaml
repos:
  - repo: https://github.com/linnea-bakshi/gha-doctor
    rev: v0.18.0
    hooks:
      - id: gha-doctor        # lint only
      # - id: gha-doctor-fix  # or: auto-fix the fixable rules in place
The hooks only trigger when files under .github/workflows/ change.
Usage
gha-doctor                      # static checks + history analysis for the current repo
gha-doctor --repo owner/name    # any repo you can read: fetches workflows + history via API
gha-doctor --lint-only          # offline: static checks only, no API calls
gha-doctor --runs 300           # sample more history
gha-doctor --workflow ci.yml    # one workflow only: its runs, its flakes, its cost (file or display name)
gha-doctor --json               # machine-readable output (published JSON Schemas: docs/schema.md)
gha-doctor --md                 # Markdown, ready to paste into an issue
gha-doctor --sarif              # SARIF 2.1.0 for GitHub code scanning (static findings)
gha-doctor --annotate           # + ::warning workflow commands: inline PR annotations in Actions
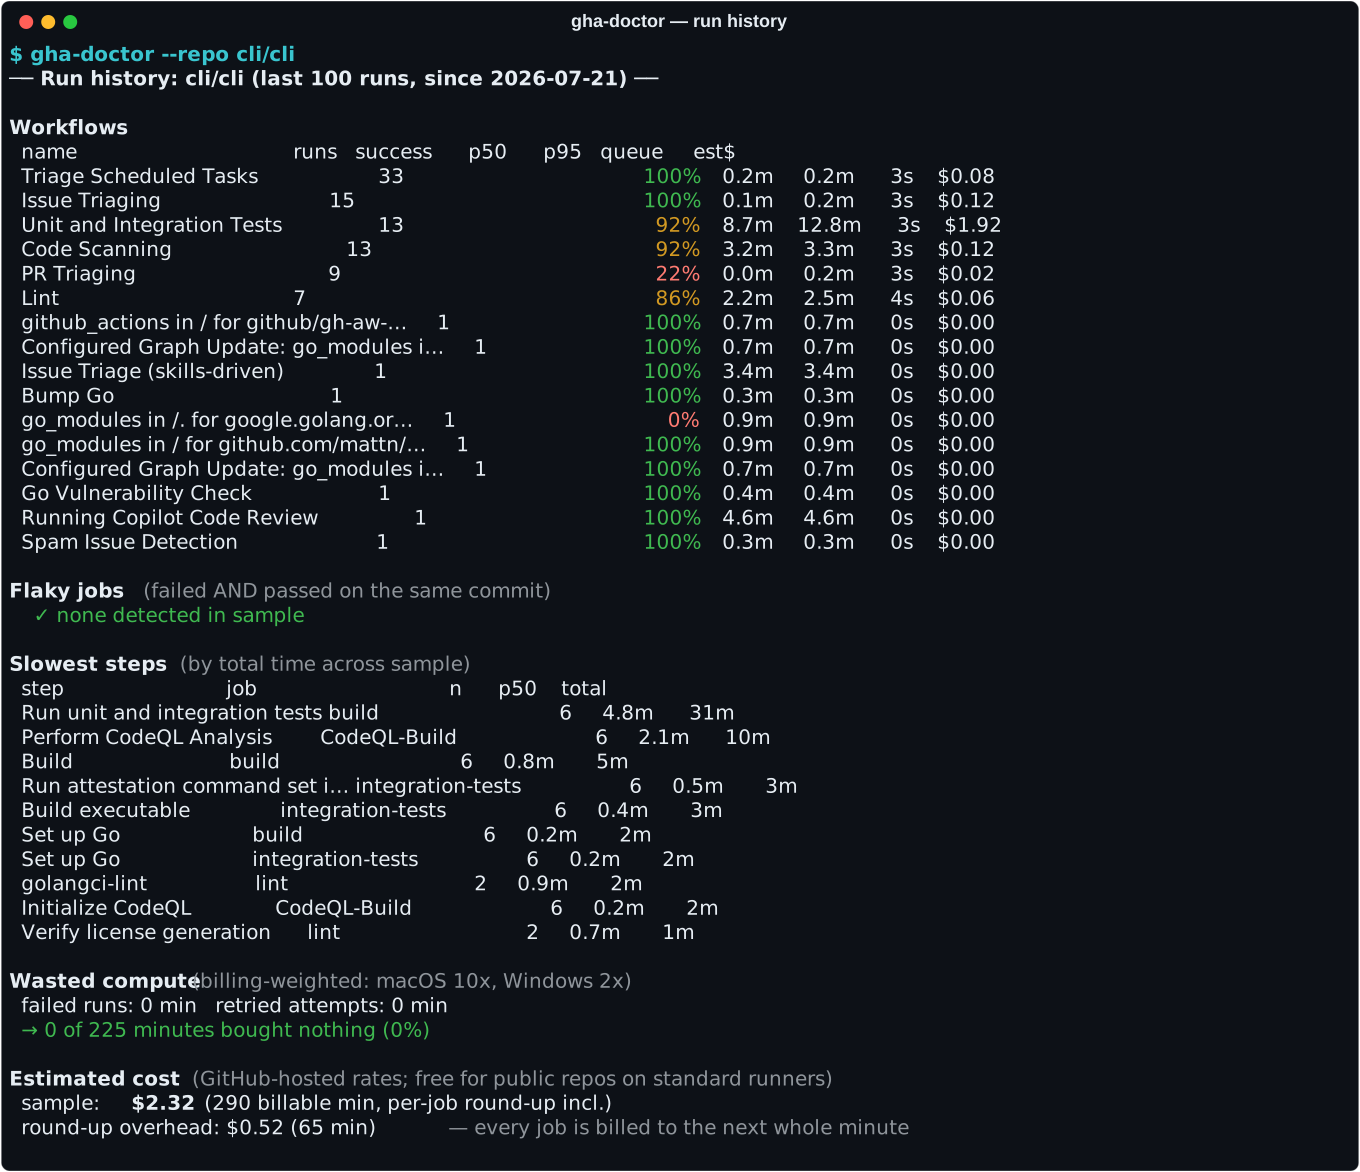
gha-doctor --fix                # auto-fix the fixable rules in place (review with git diff)
gha-doctor --diff               # preview what --fix would change as a unified diff — nothing is written
gha-doctor --repo x/y --diff    # the same patch for any repo you can read, no clone needed
gha-doctor --org yourorg        # fleet triage: every repo in an org (or user), one API call each
gha-doctor --run latest         # deep-dive one run: job waterfall + step timings vs the workflow's own p50s
gha-doctor --run 30286907962    # …by run ID or pasted run URL ("why was this run slow?")
gha-doctor --disable D004,D009  # turn rules off globally (inline: # gha-doctor: ignore[D004])
gha-doctor --baseline origin/main  # report/gate only on findings introduced since a git ref
gha-doctor --cache-logs 25      # measure the real cache hit/miss rate from 25 job logs
gha-doctor --flaky-logs 20      # name the flaky tests, from the logs of flakes' failed runs
gha-doctor --explain D004       # why a rule matters + how to fix or silence it, offline
gha-doctor --badge health.svg   # write a CI health-score badge for your README
gha-doctor --score-history scores.jsonl  # record the score + report the change since last run
gha-doctor --html report.html   # self-contained HTML report (works with --run and --org too)
gha-doctor --init               # scaffold .github/workflows/gha-doctor.yml: the PR gate, ready to commit
gha-doctor --fail-on any        # exit-2 gate severity: any finding, warning (default), or never
gha-doctor --min-score 70       # fail (exit 2) when the health score drops below 70 — independent of the findings gate
Auth for history analysis: set GITHUB_TOKEN, or just be logged in with the
gh CLI — gha-doctor picks up gh auth token
automatically. --lint-only needs no auth at all.
Building on the --json output? Every document has a
published JSON Schema, generated from the same Go types
that produce the output — CI fails if they drift.
Token scopes for private repos
Public repos work unauthenticated (a token just raises your rate limit and
unlocks log-based features like --cache-logs/--flaky-logs). For a
private repo the token needs read access to Actions data:
- Fine-grained PAT / GitHub App: Actions: read (runs, jobs, logs,
artifacts, caches) and Contents: read (remote
--repolint, config discovery,--baseline). - Classic PAT /
gh auth logindefault: thereposcope covers all of it. - Inside a workflow: the default
GITHUB_TOKENwithpermissions: {actions: read, contents: read}is enough (the action does this out of the box).
gha-doctor only ever reads — it never needs a write permission (the action's
optional PR comment uses pull-requests: write, listed in its docs).
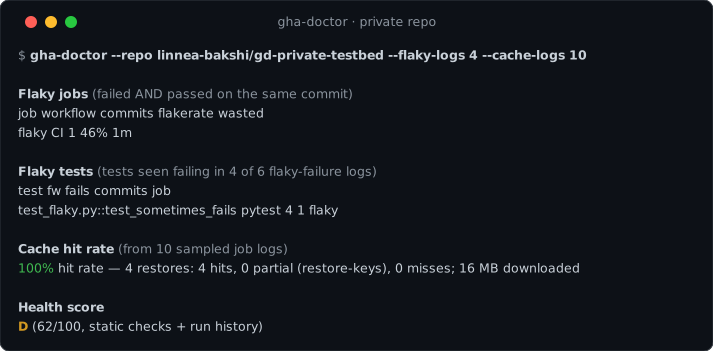
With those scopes, everything works on private repos exactly as it does on public ones — including the log-based features. Here it is naming a flaky test (not just the job) from a private repo's job logs:
Repo config file
State your repo's policy once in .gha-doctor.yml (repo root, or
.github/gha-doctor.yml) instead of repeating flags in every workflow and
alias:
# .gha-doctor.yml  (editors autocomplete this file via SchemaStore)
disable: [D004, D009]  # rules this repo has decided not to enforce
runs: 150              # history sample size (--runs)
cache-logs: 25         # job logs to sample for cache hit rate (--cache-logs)
flaky-logs: 20         # flaky-failure logs to read for flaky test names (--flaky-logs)
log-tail: 30           # failing-step log lines in --run deep dives (--log-tail)
fail-on: warning       # findings severity that exits 2: any, warning, never (--fail-on)
min-score: 70          # health score below this exits 2 (--min-score)
Explicit CLI flags beat the file; --disable adds to its list; --no-config
ignores it entirely. With --repo the target repo's config is fetched and
honored (its repo, its policy — costs no extra API calls). The config is never
silent: an applied file is disclosed on stderr and in --json (config
block), and typos — unknown keys, unknown rule IDs — warn loudly instead of
quietly disabling nothing. The GitHub Action picks
the file up automatically from your checkout. The $schema comment above is
optional — it gives you key and rule-ID autocompletion in editors running the
YAML language server (published schema).
GitHub Enterprise Server
GH_HOST=ghe.example.com gha-doctor --repo org/repo
gha-doctor targets your GHES instance when GH_HOST is set (token from
GH_ENTERPRISE_TOKEN, GITHUB_TOKEN, or gh auth token --hostname — same
conventions as the gh CLI). Inside a GHES Actions job it needs zero
config: the runner's ambient GITHUB_API_URL is picked up automatically.
One honesty note: $ estimates use github.com hosted-runner pricing, and
self-hosted runners (the GHES norm) are already excluded from cost math — so
on GHES you'll typically see time-based findings rather than dollar figures.
Exit codes: 0 clean or info-only, 2 warnings found — so you can gate CI on it
(see the GitHub Action below).
Use as a GitHub Action
This repo doubles as a composite action: it installs the release binary (checksum-verified, ~seconds) and runs it.
Adopt it in one command — gha-doctor --init writes a ready-to-commit
.github/workflows/gha-doctor.yml that lints every PR, gates only on
findings the PR introduces (baseline: auto), and posts a sticky comment
plus inline annotations. The scaffold lints clean under gha-doctor's own
rules (a test enforces it).
Or write your own. Lint gate — fail the build on workflow anti-patterns:
- uses: actions/checkout@v4
- uses: linnea-bakshi/gha-doctor@v0
Weekly checkup with history + real cache hit rate, rendered into the job summary instead of failing:
- uses: linnea-bakshi/gha-doctor@v0
  with:
    args: --repo ${{ github.repository }} --cache-logs 25
    summary: "true"
    fail-on-findings: "false"
Add --workflow ci.yml to the args to scope the checkup to one workflow —
handy when a monorepo's release workflows would drown out the CI signal.
Sticky PR comment — findings posted on the pull request, updated in place
on every push (needs pull-requests: write):
permissions:
  contents: read
  pull-requests: write
steps:
  - uses: actions/checkout@v4
  - uses: linnea-bakshi/gha-doctor@v0
    with:
      pr-comment: "true"
One comment per PR, edited on each run rather than re-posted. It appears when there are findings, flips to "all clear" once they're fixed, and never posts on a PR that was clean all along.
Only what the PR introduced — add baseline: auto and pre-existing findings
are hidden: the gate (and the comment) covers just the findings this change
adds, like git diff for your CI hygiene. Existing repos can adopt the
lint gate without fixing years of history first:
- uses: actions/checkout@v4
- uses: linnea-bakshi/gha-doctor@v0
  with:
    baseline: auto        # PR base branch; fetched automatically
The report still counts what's hidden ("3 pre-existing hidden, 1 fixed"),
so improvements show up too. On the CLI: gha-doctor --baseline origin/main.
Inline PR annotations — on by default. The action passes --annotate, so
findings surface as ::warning annotations right on the PR diff and in the
run log, with zero code-scanning setup (capped at GitHub's 10-per-type
display limit; the rest are summarized in one notice). Set
annotate: "false" to turn it off. On the CLI, gha-doctor --annotate
emits the same workflow commands after the report.
Code scanning — --sarif findings as annotations in the Security tab:
- uses: actions/checkout@v4
- uses: linnea-bakshi/gha-doctor@v0
  with:
    args: --sarif > gha-doctor.sarif
    fail-on-findings: "false"
- uses: github/codeql-action/upload-sarif@v3
  with:
    sarif_file: gha-doctor.sarif
Shareable report — --html writes the whole report (findings, run history,
top wins, health score) as a single self-contained HTML file, no external
assets or scripts — including two inline-SVG charts: every sampled run as a
duration-over-time dot (green/red by outcome), and per-workflow p50→p95
"typical vs bad day" range bars
(live example, run against psf/requests).
Publish it as a build artifact so anyone on the team can open it:
- uses: linnea-bakshi/gha-doctor@v0
  with:
    args: --html gha-doctor.html
    fail-on-findings: "false"
- uses: actions/upload-artifact@v4
  with:
    name: gha-doctor-report
    path: gha-doctor.html
Inputs: args (default --lint-only), version (default: match the action
tag, else latest), github-token (default: workflow token), summary,
pr-comment, baseline, fail-on-findings, fail-on — the severity
that gates exit 2 (any | warning | never, passed as --fail-on; needs
v0.48.0+, skipped with a note on older pins) — and min-score — fail when
the health score is below a threshold (passed as --min-score; needs
v0.61.0+; combine with fail-on: "never" to gate on score alone). The binary stays on PATH for later steps in the same
job. Pin @v0 for the latest 0.x, or an exact tag like @v0.3.0 — the
matching binary version is installed automatically.
Complete copy-paste setups — PR gate, weekly health report, README badge, SARIF/code scanning, Grafana metrics, whole-org fleet report — live on the recipes page. Every workflow there lints clean under gha-doctor itself (a test enforces it).
MCP server (let your AI agent run the doctor)
gha-doctor --mcp runs as a Model Context Protocol
stdio server, so Claude Code, Cursor, and other MCP clients can diagnose CI
as part of a conversation: "why is CI slow on this repo?", "which tests
are flaky?", "what would gha-doctor fix here?". Full guide (all clients,
tool arguments, token setup, safety model):
MCP server docs.
# Claude Code
claude mcp add gha-doctor -- gha-doctor --mcp
// generic MCP client config
{
  "mcpServers": {
    "gha-doctor": {
      "command": "gha-doctor",
      "args": ["--mcp"]
    }
  }
}
Six tools, all read-only — the server reports and previews but never
writes (applying fixes stays an explicit gha-doctor --fix in your shell):
| Tool | What it does |
|---|---|
analyze_repo | full health report: lint + history + flaky/waste/cost + score + top wins |
lint_repo | static rules only, on any GitHub repo or a local directory (offline) |
preview_fixes | the exact --fix diff, applied nowhere |
run_deep_dive | one run: waterfall, step regressions, failing tests, log tail |
org_overview | fleet triage across an org's busiest repos |
explain_rule | full documentation for a rule ID |
The server inherits your environment: set GITHUB_TOKEN (or be logged in
via gh) for history analysis and log reading; local lint works offline.
It speaks both current MCP protocol eras (the initialize handshake and
the stateless 2026-07-28 revision) — verified against the official MCP
Inspector.
It's listed in the official MCP Registry
as io.github.linnea-bakshi/gha-doctor,
so registry-aware clients can also run it from the container image with no
install: docker run -i --rm ghcr.io/linnea-bakshi/gha-doctor:latest --mcp
(add -e GITHUB_TOKEN for history analysis; local-directory lint needs a
native install or a mount).
Static rules
| ID | Severity | Checks for |
|---|---|---|
| D001 | warn | PR-triggered workflow without concurrency + cancel-in-progress (superseded runs keep burning minutes) — auto-fixable |
| D002 | warn | job without timeout-minutes (default is 360 — one hang burns 6 hours) — auto-fixable |
| D003 | warn | setup-node / setup-python / setup-java without the built-in cache: input — auto-fixable |
| D004 | info | checkout with fetch-depth: 0 (full-history clone) |
| D005 | warn | cron schedules more frequent than every 15 minutes |
| D006 | info | macOS (10x billing) / Windows (2x) runners on every push or schedule |
| D007 | warn | docker/build-push-action without cache-from (rebuilds every layer, every run) |
| D008 | info | actions/cache without restore-keys (any key miss = fully cold cache) — auto-fixable |
| D009 | info | job-level continue-on-error: true (green-washed failures) |
| D010 | info | artifact upload with default 90-day retention |
| D011 | warn | matrix expanding to ≥20 jobs per trigger |
| D012 | info | npm install instead of npm ci in CI — auto-fixable |
| D013 | warn | unscoped push + pull_request double-trigger (every PR commit runs CI twice) |
| D014 | info | cron at minute 0 (peak-load window; GitHub delays/drops top-of-hour schedules) — auto-fixable |
| D015 | warn | action version GitHub has shut down (upload/download-artifact@v1–v3, cache@v1–v2) — the step fails at runtime, every run — auto-fixable (cache only; artifacts changed semantics in v4) |
| D016 | warn | retired hosted runner label (ubuntu-20.04, windows-2019, macos-13, …) — the job cannot run; resolves ${{ matrix.os }} too — auto-fixable (ubuntu only: same-arch bump to ubuntu-24.04; windows/macos targets are your call) |
| D017 | info | nothing updates your action pins — no dependabot github-actions ecosystem, no renovate config (repo-level check; this is how repos end up on D015/D016) |
| D018 | warn | deprecated workflow commands in run: steps — ::set-env/::add-path (disabled 2020, error at runtime) and ::set-output/::save-state (deprecation warning on every run, removal announced) — auto-fixable (rewrites simple echo lines to $GITHUB_OUTPUT-style environment files) |
| D019 | warn | deprecated Node runtime in the actions you publish — action.yml declaring runs.using: node12/node16 (runtimes already removed from runners) or node20 (removal from runners announced for fall 2026: the action stops working, for everyone using it). Scans root/subdir/.github/actions manifests; composite-action steps get the D015 and D018 checks too |
| D020 | warn | hosted runner label with an announced retirement — ubuntu-22.04 (brownouts from Sept 17, 2026; gone April 17, 2027) and macos-14 (brownouts since July 6, 2026; gone Nov 2, 2026). D016 on a countdown: migrate on your schedule, not during a brownout — auto-fixable (ubuntu only) |
| D021 | info | scheduled workflow without a github.repository guard — fork owners who enable Actions get your crons too (failed secret lookups, bot spam in forks) |
Every rule comes with a one-line fix, and line numbers point at the exact spot in
your YAML. Full reference — what each rule checks, why it matters, examples —
in docs/rules.md, or offline via gha-doctor --explain D004.
Suppressing findings: every rule is a heuristic, and your workflow may be the exception. Silence a single finding with a comment on the flagged line (or on its own line directly above):
- uses: actions/checkout@v4
  with:
    fetch-depth: 0  # gha-doctor: ignore[D004]  (semantic-release needs history)
A bare # gha-doctor: ignore silences every rule on that line; IDs are
case-insensitive. Turn a rule off everywhere with --disable D004,D009.
--fix respects both — a suppressed finding is never auto-fixed.
Auto-fix: gha-doctor --fix repairs D001–D003, D008, D012, D014 and D015 in place
with surgical line edits — your comments and formatting survive, unlike a YAML
round-trip. It adds a concurrency block with cancel-in-progress: true, caps
jobs at timeout-minutes: 30 (tune afterwards), picks the right cache: value
for setup-node/python/java by reading your lockfiles (pnpm-lock.yaml →
pnpm, poetry.lock → poetry, pom.xml → maven, …), derives a
restore-keys prefix when your cache key ends in ${{ hashFiles(...) }},
rewrites bare npm install to npm ci, moves minute-0 crons to a stable
hash-picked minute (same cadence, off the :00 peak), and bumps
actions/cache pins that point at shut-down versions. Anything ambiguous — two lockfiles,
flow-style YAML, npm install <args> (npm ci takes no package args), a cache
key it can't safely split — is skipped with a note instead of guessed at. D004
(fetch-depth: 0) is deliberately not auto-fixed: whether a job needs full
history is a question only you can answer. Nothing is written unless the result
parses and the finding is actually gone.
Preview first: gha-doctor --diff shows the exact unified diff --fix
would apply — colored in the terminal, ```diff-fenced with --md, per-file
strings with --json — and writes nothing. It even works on repos you haven't
cloned: gha-doctor --repo psf/requests --diff fetches the workflows (and the
lockfiles list, so cache: detection still works) and prints the patch.
The output is a standard unified diff: redirect it to a file and it applies
cleanly with git apply on a checkout of the same commit — e.g.
gha-doctor --repo apache/spark --diff > fixes.patch && git apply fixes.patch
(verified against apache/spark's 45 workflow files: the patch applies
byte-exact and every patched file stays valid YAML).
History analysis
With API access, gha-doctor samples your recent completed runs (default 100) and reports:
- Per-workflow health — success rate, p50/p95 duration, average queue time.
- Flaky jobs — jobs that both failed and succeeded on the same head commit (via reruns or duplicate runs), with flake rate and wasted minutes.
- Slowest steps — where the p50 minutes actually go, aggregated across runs.
- Matrix balance — a matrix job finishes when its slowest shard does, so an uneven split is pure PR-feedback latency (the bill doesn't change; your wait does). Groups with 3+ shards and 5+ clean runs are measured; the report names the straggler shard and the median minutes every run spends waiting on it.
- Duration trend — is the build getting slower? Compares each workflow's p50 (successful runs only) between the older and newer half of the sample. Only measured with 12+ successes spanning 24+ hours, and only reported past both a 20% and a 1-minute shift; a 30%+ slowdown earns an "investigate" slot in the top wins (honesty gates).
- Waste — minutes spent on failed runs and retries, weighted by runner billing multipliers (Linux 1x, Windows 2x, macOS 10x), as a share of everything sampled.
- Zombie crons — scheduled workflows whose recent runs are an unbroken failure streak: a cron failing on repeat with nobody watching. Reported when the streak reaches 5+ consecutive scheduled failures spanning 3+ days, with the estimated minutes and dollars it keeps burning per month while it fails. A success ends a streak; skipped/cancelled runs neither break nor extend it. (Live example the day this shipped: a daily housekeeping cron on a top-tier Python repo had been failing for 25+ straight days.)
- Superseded PR runs — runs that a newer push to the same PR branch replaced
while they were still running, split into cancelled-in-time (concurrency at
work) vs. ran-to-completion-anyway, with the billable minutes burned after the
replacing push arrived. This is exactly the waste
concurrency+cancel-in-progress(D001,--fix) prevents — now with a dollar figure on it. Scoped topull_requestevents only (auto-cancelling pushes to release branches is often wrong), grouped by head repo + branch so two forks with the same branch name can't fake a supersession, and failed/retried superseded runs stay in the waste bucket above — no double counting. - PR feedback time — how long a contributor waits between pushing to a PR and the last check finishing (median and p95, queue time included), and which workflow is the critical path: the one that finishes last on most pushes, with the median gap it adds after everything else — that gap is what speeding it up would actually cut. Only pushes whose full verdict arrived count: superseded, awaiting-approval, and later-re-run pushes are excluded (honesty gates).
- Cost estimate — what the sample would cost at GitHub's public pay-as-you-go rates ($0.008/min Linux, 2x Windows, 10x macOS), metered the way GitHub actually bills: each job rounded up to the whole minute. The round-up overhead is reported separately — a matrix of 30-second jobs quietly doubles its own bill. Self-hosted jobs are excluded (GitHub doesn't bill them). Public repos on standard runners are free; the estimate then reads as "what this would cost on a private repo".
- Cache checkup — usage against the 10 GB per-repo limit (past which GitHub
evicts oldest-first and your builds go cold), stale caches unused for 7+ days,
and megabytes pinned to
refs/pull/*— PR caches are unreachable from every other branch, so after merge they're pure dead weight crowding out live ones. - Artifact checkup — who uploads the storage weight and how long it's kept. Artifacts bill at $0.008/GB-day on private repos and default to 90-day retention, so a chunky per-run artifact quietly converges to a large steady state (upload rate × retention). Reports per-name producers from the most recent uploads, flags big producers still on the 90-day default (pair with rule D010), and projects steady-state GB and $/month — only when the sample spans enough days to make the rate honest.
- Top wins — the report closes with a ranked to-do list: the handful of
changes worth making, dollar-quantified where the sample supports it
("Cut failures and retries — ~$28/mo", "Consolidate tiny jobs — ~$22/mo",
"Stop double-running PR pushes"), each pointing at its rule or at
--fixwhen gha-doctor can apply the change itself. Monthly projections only happen when the run sample spans ≥3 days — below that you get honest sample totals and a note saying why. - Flaky tests, by name (
--flaky-logs N) — flaky-job detection tells you where it hurts; this tells you which test. It reads the logs of up to N failed job runs whose commit also passed (the same-SHA fail+pass pairs from the flaky-jobs table) and extracts the failing tests using the frameworks' own failure summaries — 28 framework families: pytest, Python unittest (incl. Django's runner),go test,cargo test, jest, vitest, playwright, Cypress, mocha, ava, rspec, minitest, phpunit, exunit, maven surefire, gradle (JUnit), sbt, .NET (xunit v3 / VSTest), XCTest (xcodebuild,swift test, and xcbeautify output), swift-testing, LLVM lit, meson test, GoogleTest, CTest, doctest, bazel, cargo-nextest, and node-core test.py — including tests that run insidedocker build(BuildKit's log prefix is stripped). Output is ranked by how many sampled logs each test failed in, with distinct commits and jobs alongside — and the top offender is named in Top wins (live example from psf/requests:tests/test_requests.py::TestRequests::test_pyopenssl_redirect). Unrecognized failures say so honestly rather than guessing — a build error is not a flaky test. When a flaky run's logs speak no recognized format, its uploaded test-report artifacts (JUnit XML / .NET TRX / NUnit3 / TestNG) are consulted as a fallback (only when every failed job in that run was itself flaky-proven — a genuinely broken sibling job must not read as flaky; run-level attribution, own subsection). Needs auth, like everything that downloads logs. - Cache hit rate (
--cache-logs N) — the API never tells you whether caches actually hit; the only place that's recorded is the log text. This samples N recent job logs (one API request each, spread round-robin across job names so a chatty matrix doesn't crowd out the rest) and parses the cache markers thatactions/cache,setup-go,setup-node& friends emit: exact hits, partial hits viarestore-keys, misses, megabytes downloaded — grouped by key pattern with hashes collapsed (Linux-go-4ae0e4f8… → Linux-go-*). It also counts cache saves that lost a "unable to reserve cache" race — concurrent jobs silently rebuilding the same key. Needs auth: log downloads 403 without a token even on public repos.
Single-run deep dive (--run)
"Why was this run slow?" — point --run at a run ID, a pasted run URL, or
latest, and get the one run dissected:
- A job waterfall on the run's wall clock: queue wait (
·) vs execution (█), colored by conclusion, so parallelism gaps and runner starvation are visible at a glance. - Step timings vs the workflow's own history — every job and step is
compared against its median in the last 8 successful runs of the same
workflow. The verdict names the regressions:
⚠ "Install dependencies" in build (3.12, windows-latest): +59s vs its p50 (3.7x slower). - Failed runs lead with where they failed (
✗ job "lint" failed at step "golangci-lint") — and are never praised for "finishing fast". - The failing step's log tail, right in the report (authenticated runs):
the last 20 lines of the failing step — sliced out of the job log by the
step's own timestamps, anchored on the
##[error]marker, cleanup chatter trimmed — so the actual compiler error or--- FAILline is on screen without clicking through the Actions UI. Tune with--log-tail N(0 turns it off). - The failing tests, by name (authenticated runs): the job log is run
through the same 28 framework extractors
that power
--flaky-logs, so a red run's verdict reads✗ job "test (3.12)" failed at step "pytest" — 3 failing tests incl. tests/test_retry.py::test_backoffinstead of making you scroll the log. Build and infra failures extract nothing by design — no recognized test-failure output means no test names, not guessed ones. - Test-report artifacts as the fallback (JUnit XML / TRX / NUnit3 / TestNG) (authenticated runs):
when the failed jobs' console output speaks no recognized format, the
run's uploaded artifacts are checked for JUnit XML reports (
pytest --junitxml, surefire, Gradle, jest-junit,ctest --output-junit, …), .NET TRX files (dotnet test --logger trx), NUnit3 reports (nunit3-console,dotnet test --logger nunit, Unity's test runner) or native TestNG results (testng-results.xml— selenium-style automation suites often upload only that) and the failing tests are named from those — exact names for any framework that writes the industry-standard report file. Listed at run level with the source artifact named, because artifacts belong to the run, not to one job — attribution never pretends otherwise. - Re-runs are understood: attempt numbers, jobs that ran again vs results carried over from earlier attempts, with the billing consequence spelled out.
- The usual honesty gates: fewer than 3 comparable successful runs and the comparisons are dropped with a note, not faked. In-progress runs say "so far" instead of getting a verdict.
Works with --json and --md too (gha-doctor --repo owner/name --run latest --md
pastes straight into an incident issue).
Health score & badge
Everything measured is condensed into a 0–100 CI health score (A+–F), itemized so you can see exactly where the points went:
Health score
  F  (54/100, run history only)
  ✗ success rate       −17.5  72% of 100 sampled runs succeeded
  ! queue time         −0.3   average 6 s waiting for a runner
  ! flakiness          −5     1 job failed AND passed on the same commit
  ! wasted minutes     −4.1   8% of sampled compute minutes went to failed runs or retries
  ✗ cache pressure     −5     cache storage at 101% of the 10 GB limit (evictions likely)
--badge health.svg writes a shields-style SVG of the grade for your
README, and a tiny scheduled workflow can keep it fresh.
--score-history scores.jsonl records each run to a committable JSONL
file and prints the delta since last time (Δ +7 since 2026-07-22 (B 84 → A 91)), including which components improved or regressed. Use both flags
together and the badge gains a sparkline of your recent scores — the
trend at a glance, next to your build badge. Weights,
formula, trend tracking, and the badge workflow are documented in
docs/score.md.
Prometheus / Grafana (--prom)
gha-doctor --prom ci-health.prom # alongside the normal report
--prom writes every measured aggregate — health score, findings by
severity, per-workflow success ratios and p50/p95 durations, queue time,
wasted and rounded-up compute (seconds and USD), flaky jobs, zombie
crons, cache size against the 10 GB limit, superseded-run waste, PR
feedback time — in the Prometheus text exposition format. Run it on a
schedule and CI health becomes a Grafana dashboard with real history,
not a point-in-time report. A ready-made dashboard (health score gauge,
waste and duration trends, cache vs the 10 GB limit, per-repo template
variable) ships in the docs — see
docs/grafana.md,
verified against a live Grafana + Prometheus stack.
Two easy wirings:
-
Textfile collector (self-hosted runner or any box with node_exporter): write the file into the collector's directory —
gha-doctor --prom /var/lib/node_exporter/textfile/gha-doctor.prom. -
Pushgateway (hosted runners): a scheduled workflow pushes the export —
- run: |
    gha-doctor --fail-on never --prom metrics.prom
    curl --data-binary @metrics.prom \
      https://pushgateway.example.com/metrics/job/gha-doctor/instance/${{ github.repository_owner }}-${{ github.event.repository.name }}
Honesty carries over: anything the run didn't measure emits no series
at all (a gap on the dashboard is the truth; a zero-filled series
would be a lie), while a measured zero — zero flaky jobs across a
sampled window — is a real 0. Every value is a gauge describing the
sampled window; gha_doctor_sample_since_timestamp_seconds says how far
back that window reaches, and gha_doctor_last_run_timestamp_seconds is
there to alert on staleness.
Org-wide triage (--org)
gha-doctor --org yourorg              # 20 most recently pushed repos, 100 runs each
gha-doctor --org yourorg --max-repos 50 --md   # bigger fleet, Markdown for an issue
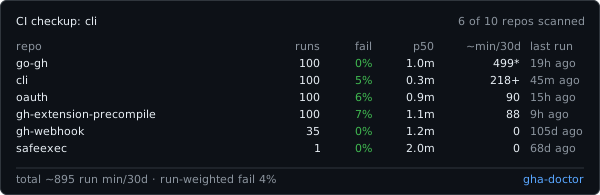
One screen for the whole org: per-repo run volume, failure rate, p50/p95
duration, and estimated wall-clock run minutes per 30 days — sorted by who's
burning the most. Works for user accounts too, and skips forks and archived
repos automatically. It also names zombie crons anywhere in the fleet —
scheduled workflows whose sampled runs are an unbroken failure streak (same
gates as the repo-level check), spotted from the run samples already fetched
at zero extra API cost. Dead lock-issues bots and broken nightlies quietly
inflate a repo's fail rate for months; the fleet view points straight at
them. No $/month projection here — the org scan never fetches job data, so
pricing would be a guess; drill in with --repo for the billable burn.
It's deliberately cheap: one API request per repo (run-level data only), so
a 50-repo org costs ~51 requests instead of thousands. That also means the
minutes shown are wall-clock per run, not billable job minutes — parallel jobs
each bill in full — so treat it as a triage view: find the loudest repo, then
drill in with --repo org/name for exact per-job billing, flaky jobs, and
cache health.
Fleet card (--org + --svg)
gha-doctor --org yourorg --svg fleet.svg
writes the fleet table as a self-contained SVG card you can embed in an org profile README or a dashboard (busiest 12 repos + aggregate tail; regenerate it from a scheduled workflow the same way as the score badge):
Comparison
| actionlint | zizmor | gha-doctor | |
|---|---|---|---|
| Focus | correctness | security | speed / cost / reliability |
| Static workflow checks | ✅ | ✅ | ✅ (perf & cost rules) |
| Uses your run history | ❌ | ❌ | ✅ |
| Flaky-job detection | ❌ | ❌ | ✅ |
| Wasted-minutes estimate | ❌ | ❌ | ✅ |
| $ cost estimate (incl. round-up) | ❌ | ❌ | ✅ |
| Cache-limit / stale-cache checkup | ❌ | ❌ | ✅ |
| Cache hit-rate measurement (from logs) | ❌ | ❌ | ✅ |
| Artifact storage / retention checkup | ❌ | ❌ | ✅ |
They compose: run all three. For a detailed, honest breakdown — including where the three tools overlap — see gha-doctor vs actionlint vs zizmor.
License
MIT © Linnea Bakshi